
State of the Economy
Sentiment may be bottoming out, tariff related buying slowing, consumers await price impacts
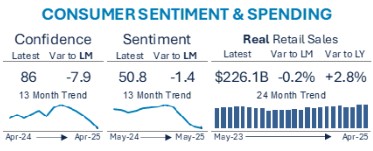
- Consumer confidence fell again in April, down nearly 8 points from March, down 24 from the Oct ’23 election high and down 11.5 from last April (perhaps a more reasonable comparison than October). While not shown here, small business optimism has followed a similar trend, especially for those dependent on foreign goods.
- Despite some progress on tariffs with the UK deal framework and a de-escalation with China to a lower, but still high, 30% tariff rate, consumer sentiment remains lower with the early May reading at 50.8, down 1.4 points from April and more equally spread between lower sentiment on both current conditions and future expectations. Concerns remain broad as consumers are waiting to see how tariffs translate into a combination of price and availability.
- Tariff-related buying slowed in April; inflation adjusted (“real”) spending was down to March, but up slightly on a nominal basis and remains up last year. Continued strength in wages, moderating inflation and low unemployment have helped keep retail sales strong. April retail sales were dominated by strong restaurant spending from the Easter shift.
Employment picture generally stable, wages outpace inflation with some weakness developing
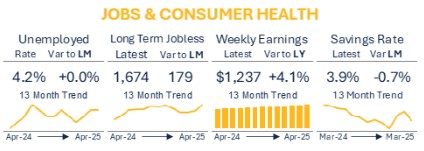
- Key “hard” data elements continue to show resilience and strength from an employment and wage perspective.
- Unemployment remains low, flat to March at 4.2%, which when combined with labor force participation (not shown here) continued to point to a full employment economy.
- Long-term jobless remain elevated and concerning since any deterioration in unemployment rate could significantly increase this number and the associated economic impact from a high number of employed could accelerate recessionary trends.
- Wage growth in terms of weekly earnings were strong at 4.1%, eclipsing inflation by over 100 basis points. With wage growth significantly above inflation, the opportunity for consumers to stay ahead of inflationary pressures increases and can further strengthen resiliency especially in face of potential price pressure from tariffs.
- With higher spending, savings rate took a dip in March, down below 4%. Households still need to rebuild depleted savings and continued soft savings rates are a sign that households are still achieving economic equilibrium. The recent trend prior to March was encouraging and perhaps March will prove to be a one-time decline. Will continue to closely monitor.
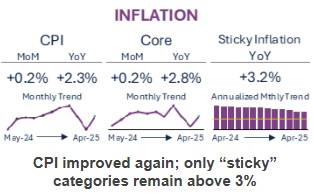
CPI improved again; only “sticky” categories remain above 3%
- Overall CPI declined again in April, down to 2.3% with improvement in most categories. Groceries saw significant month-over-month improvement led by eggs. Food away from home (restaurant and quick service) were up as the Easter shift encouraged more eating out. Gas and fuel oil continue to see price declines while other energy services continue to see some price pressure.
- Within core, up 2.8% over the prior year, shelter increases continued to slow to a 4.0% annual increase, slowest now since Nov ’21. Car insurance and medical care (also part of the “sticky”) increased 6.4% and 2.7%, respectively.
- The key concern for CPI remains tariffs. While companies built up inventories in anticipation of higher tariffs, the length and breadth of trade negotiations will dictate how and when prices may increase. For now, don’t anticipate higher prices before May / June CPI.
Disclaimer
This summary is provided for informational purposes only and does not give and should not be construed as giving business, investment, legal, tax or other advice. This presentation has been prepared without taking into account the financial or business objectives, situation or particular needs of any particular person. Without limiting the generality of the foregoing, Bread Financial is making no projections or statements about (1) the future financial performance of any company or Bread Financial, (2) the development of any company’s or Bread Financial’s business, or (3) how any of the information may affect any company’s or Bread Financial’s business. The information is presented for the recipient to evaluate, and Bread Financial disclaims any responsibility for any reliance on the information – all recipients of the information should independently review and research the information presented, evaluate their own information and information from other sources, and reach their own independent conclusions. Actual events and outcomes could differ materially from those anticipated in this presentation. This presentation constitutes confidential information and is provided to you on the condition that you agree to hold it in confidence and not copy, reproduce, disclose or distribute it in whole or in part without the prior written consent of Bread Financial.
Definitions & Sources
- CPI is sourced from the Bureau of Labor Statistics with additional insight on Sticky Inflation coming from the St. Louis Fed – FRED (Federal Reserve Economic Data) based on their public releases.
- The orange line for Sticky Inflation represents the target rate that the Fed has publicly stated.
- Consumer Sentiment is sourced from the monthly University of Michigan survey and due to timing of release tends to run ahead of Consumer Confidence which is sourced from The Conference Board monthly survey.
- Real Retail Sales comes from FRED with inflation indexed to 1982-1984.
- Unemployment data on both the unemployment rate and the number of persons dealing with long term unemployment (27+ weeks) are both sourced from FRED.
- Weekly wage data is the nominal (not inflation adjusted) weekly wages reported by FRED from the Bureau of Labor Statistic monthly release and is a combination of weekly work hours and hourly wages and is only private industry data (does not include government wages).
- Savings Rate data is also sourced from FRED and is sourced from the US Bureau of Economic Analysis based on their Personal Income and Outlays release.
- All commentary is proprietary to Bread Financial and reflects Bread’s assessment or summation of publicly available data, commentary, and resources combined with Bread’s perspective based on this data and other proprietary data sources.
About Bread Financial®
Bread Financial® (NYSE: BFH) is a tech-forward financial services company that provides simple, personalized payment, lending and saving solutions to millions of U.S. consumers. Our payment solutions deliver growth for some of the most recognized brands in travel & entertainment, health & beauty, technology, electronics, jewelry, home and specialty apparel through our co-brand and private label credit cards and pay-over-time products providing choice and value to our shared customers. Additionally, we offer Bread Financial general purpose credit cards and saving products that empower our customers and their passions for a better life.
Bread Financial proudly marks 30 years of success in 2026. To learn more about our global associates, our performance and our sustainability progress, visit breadfinancial.com or follow us on Instagram and LinkedIn.